What is opCharts?
Interactive Dashboards And Charts
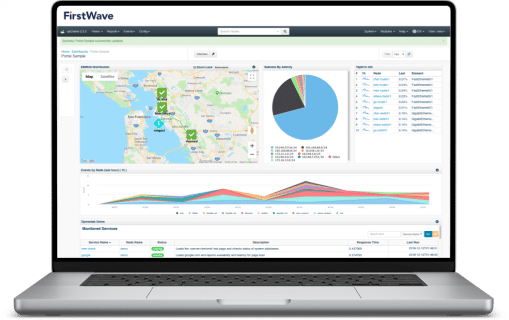
Through the use of user-defined metadata, opCharts combines and sorts devices into dynamic groups providing key performance metrics at every level.
opCharts’ built-in ability to roll-up and provide high-level abstracted user views, while still allowing a quick drill-down into detailed performance metrics, provides fast access to information to those who need it most.
Developed to display large amounts of data through a dynamically responsive interface, opCharts allows users to see the live state and history of all systems all on the same page.


"We take new ideas to FirstWave about how we'd like to see their products work and they add our ideas to the product roadmap. The relationship could not be any easier. I consider them an extension of my team."
Dayle Wilson
Chief Product & Operating Officer

"After a long and in-depth search for a network monitoring solution, we found [FirstWave] the best fit for all our needs. With their excellent support, onsite training, and almost unlimited ability to be customized to fit our needs, it was no contest."
Kurtis Bredda
Director of Network Services

"NMIS is hands down one of the best data collection monitoring suites we have ever used. The data and enriched alerting it provides is exactly what we were looking for to make data-driven network decisions for upgrade and growth. It has set us on the path from reactive to proactive!"
Jodan Long
Director of Network Operations

“After years of having multiple monitoring systems, we finally have a single one that works and is configurable to meet our needs.”
Paul Pyyvaara
Director of Operations

"Our engineers prefer using opCharts as the speed and responsiveness of the GUI makes it a far more usable product then our previous app."
Art Smolecki

"With NMIS and FirstWave we have a true partner that we can rely on to make sure we are on top of any issues on our network and have good data and analytics to make sure our customers get top-notch service."
Bill Farmer
Senior Platform Engineer
"As a telecommunications provider with a country wide presence, we rely heavily on to-the-minute alerting, live graphical statistics and reporting. NMIS provides the flexibility to satisfy all of those requirements."
Leigh Havas
System Administrator

"NMIS for the win! I like that it's agentless, and when you do need support you get quickly connected to engineers, not jumping through hoops and waiting."
Phil Shannon
Senior Systems Engineer

"Great features right out of the box, such as business rules and the ability to model any piece of equipment. All of the key features can be accessed through the GUI, but I can edit everything in the command line if I need it."
Davide Yachaya

"NMIS is open-source, easy to deploy and maintain. The feature set of this product is amazing as it allows you to monitor every single Network device within our organization."
Hensley Dass
Core Network Engineer

"It’s not that companies *can* do automation, it's *how* you do automation, and at the end of the day FirstWave showed they were much better at it.’’
Milan Atanackovic
Vice President Of Engineering
opCharts Benefits
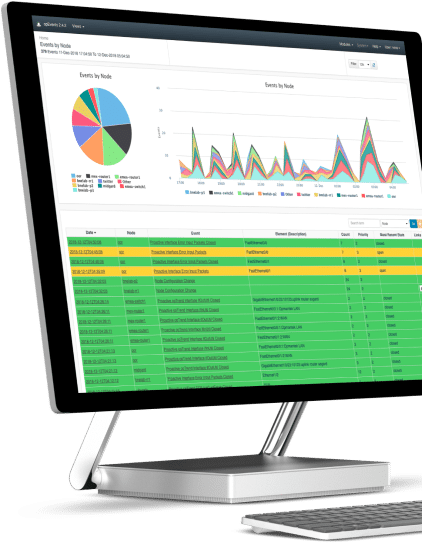
Spot On Data Visualization, Interactive Dashboards and Charts

Complete Mapping
Nested maps that show the information that is relevant to you. From every device across the world down to each access point on a building’s floor, including the devices’ health metrics & events.

Easily Create Custom Dashboards
No longer wait for the network team to build your diagrams. Simple to use geographic and topological mapping, custom charts, and personalized network diagrams can be effortlessly generated and added to a business dashboard in moments.

Integrate With Everything
A RESTful API allows users to extract information from any of our systems; JSON integration allows for opCharts to display nearly anything, providing unmatched flexibility and access

Business Service Monitoring
Highly adaptable user authorization, enabling organizations to create dashboards and charts for individuals and groups of users, and manage third-party vendor access more diligently.

Network Diagrams & Maps
Perfect for displaying your network using the latest maps. Live updates are showing your network health right now on a world-to-city basis. Easily set up as individual maps or even include them in more extensive dashboards.

Flexible Search & Display
Find any device anywhere quickly. Using our latest schema-driven components, the filtering and grouping of your inventory are endless across any logical or physical attributes.
Download Data Sheet
Find out how FirstWave opCharts can help you see your network like never before?
Free Download Book A Call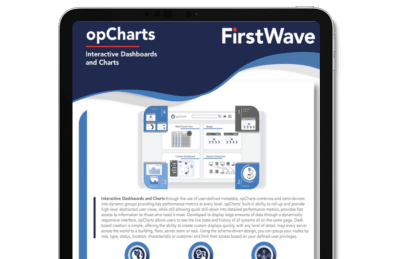
opCharts Features
High-Power Out-of-the Box Features For Intelligent Network Management

Single Pane Of Glass
- Incorporate node data from NMIS
- opCharts also allows multiple vendors, technologies, or operating systems
- See the current state or full history of all systems in one location
- Flexible enough to incorporate new technologies

Business Services
- Group all related nodes/ interfaces together to have one single location to monitor services
- opCharts uses an MSP authorization system, a user/role can be created to view particular business services: all nodes/ interfaces added to a business service will be visible to users with access to that business service
- Monitor availability/ reachability for all nodes/ interfaces in a business service to ensure SLA levels

User Management
- Role-based access control (RBAC) over devices
- Custom business hours rules

Ready to Go
- Out-of-the-box dashboards
- Quickly drill down on any information that is displayed
- Accessible from any common browser

Easy Implementation
- Easy installation
- CSV import and script ready
- Support available for installation and customization
- Professional services are available for design and implementation
- MongoDB is automatically installed + Agentless log collection

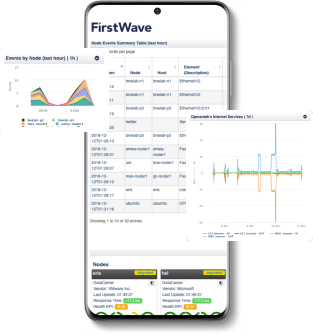
Accessibility
- Accessible from any device
- Large Community wiki
- Single Sign On across all our applications

Flexible Licensing
- opCharts is licensed by the node count
- There are no limits on the number of users that are added or dashboard that can be created
- Infinitely scalable architecture

Pricing and Purchasing
- Predictable license costs
- MSP Scale licensing is available
- Unlimited software use of the product

Sales and Support
- Easy to purchase – trial it yourself for free or contact us for a demo
- Support portal access
- Complete documentation and support wiki available
- Pay-as-you-grow options are available
The Platform Used By The World's Leading Service Providers


Download opCharts
FirstWave’s opCharts module allows you to build elegant graphical interfaces that allow you to combine maps, charts, and data feeds to understand your network at a glance.
Pricing
Get A Custom Quote
- Predictable and transparent pricing
- Pricing that scales with you
- Support is always included
FirstWave’s team can help you get a quote that meets your requirements. A 15-minute call is all it takes. This is not a sales call—it’s an opportunity for you to tell us about your organisation’s network management needs.
Setup Guide
Need Help Getting Started?
Download opCharts
With interactive charts and dashboards, opCharts is a complete dashboarding solution that visualizes your IT infrastructure.
Quick Setup
Install +
Please note that NMIS must be installed on your machine before adding opCharts or most other FirstWave network management modules. Please ensure you have installed NMIS before installing opCharts. NMIS is the underlying software required to run any of FirstWave’s individual network monitoring and management modules and can be installed on Linux. If you do not have a machine currently running Linux, you can download and install the FirstWave Virtual Machine, which includes NMIS and all FirstWave network monitoring software modules. The following installation guide should be sufficient for most users’ needs. Advanced instructions and troubleshooting are available on the opCharts Wiki.
1. Download the opCharts installer
If you haven’t already, hit the download button above and download the opCharts Installer. The Installer comes as a .run file.
2. Run the Installer in Linux Terminal
Open the Linux Terminal. Start a Terminal instance as the root user through the following command, entering your password when prompted: sudo -i
If you have not been granted access to the root user, contact your system administrator. Once your terminal session is run by the root user, run the shell command to begin the installation process
sh opCharts-<version number>.run
Press Y or Return/Enter when the installer prompts you. Several times throughout the installation process you will be prompted to approve the various components of the opCharts Module as they are installed on your machine. Please take note of any relevant information as you approve each step. When the installation is complete, the following will print on the Terminal:
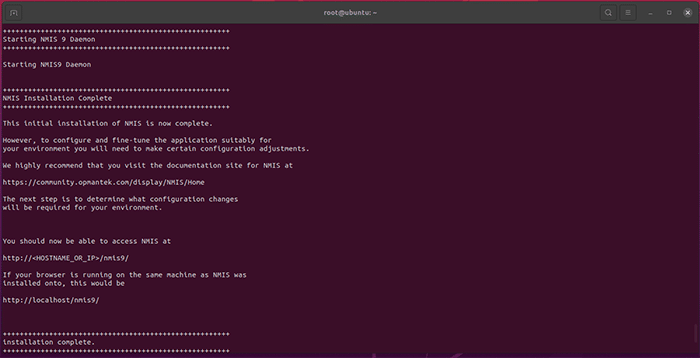
You’re now ready to license opCharts.
License +
Good news! Each of FirstWave’s network monitoring software modules offers a free time-unlimited 20-node license. The first time you open each program, you will be given the opportunity to activate a free license.
Time-limited trials are also available if you want to test the software on a larger network, and licenses for running FirstWave’s software modules on larger networks are available by request.
Configure +
Open opCharts
opCharts allows you to explore the details of the network which you have configured in NMIS. You can use opCharts to improve visibility and maintain consistency across your whole IT environment through advanced tracking of device and network configuration settings.
Explore FirstWave’s extensive software documentation
You’re now ready to configure opCharts to exactly your needs and to begin monitoring events on your network using the guides on the FirstWave Wiki. In no time at all, you’ll have a fuller view of your network than you’ve ever had before.
Video Setup Guide +
Ready To Take the Next Step with opConfig?
Book In For A Guided Demonstration
Book in your custom demo with one of our software specialists to see the power of our network solutions in action. All demonstrations are interactive, personalized, and free.
For Further Information
FirstWave Head Office
FirstWave Technical Support
Support Email
FirstWave Sales Support
Sales Email
Need Help?
Find out how FirstWave can scale your network
management and cybersecurity of your business?